'Hacking' IKEA Home Smart VINDSTYRKA
Introduction
IKEA is a Swedish multinational conglomerate that designs and sells ready-to-assemble furniture, kitchen appliances, decoration, home accessories, and various other goods and home services. Since 2016 IKEA also moved into the 'smart home' business. The smart home offering consists of devices like lamps, speakers, air purifiers and various sensors on one hand and an infrastructure of hubs and an app to glue things together.
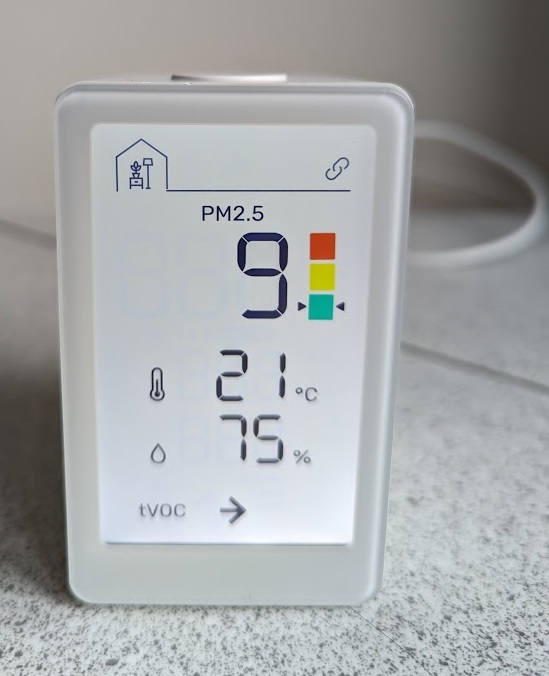
Here I want to focus on VINDSTYRKA, this is a device to monitor, and report, air quality. My objective is reading information from the device using a Raspberry Pi.
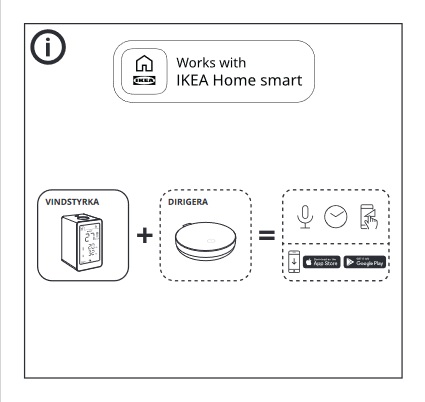
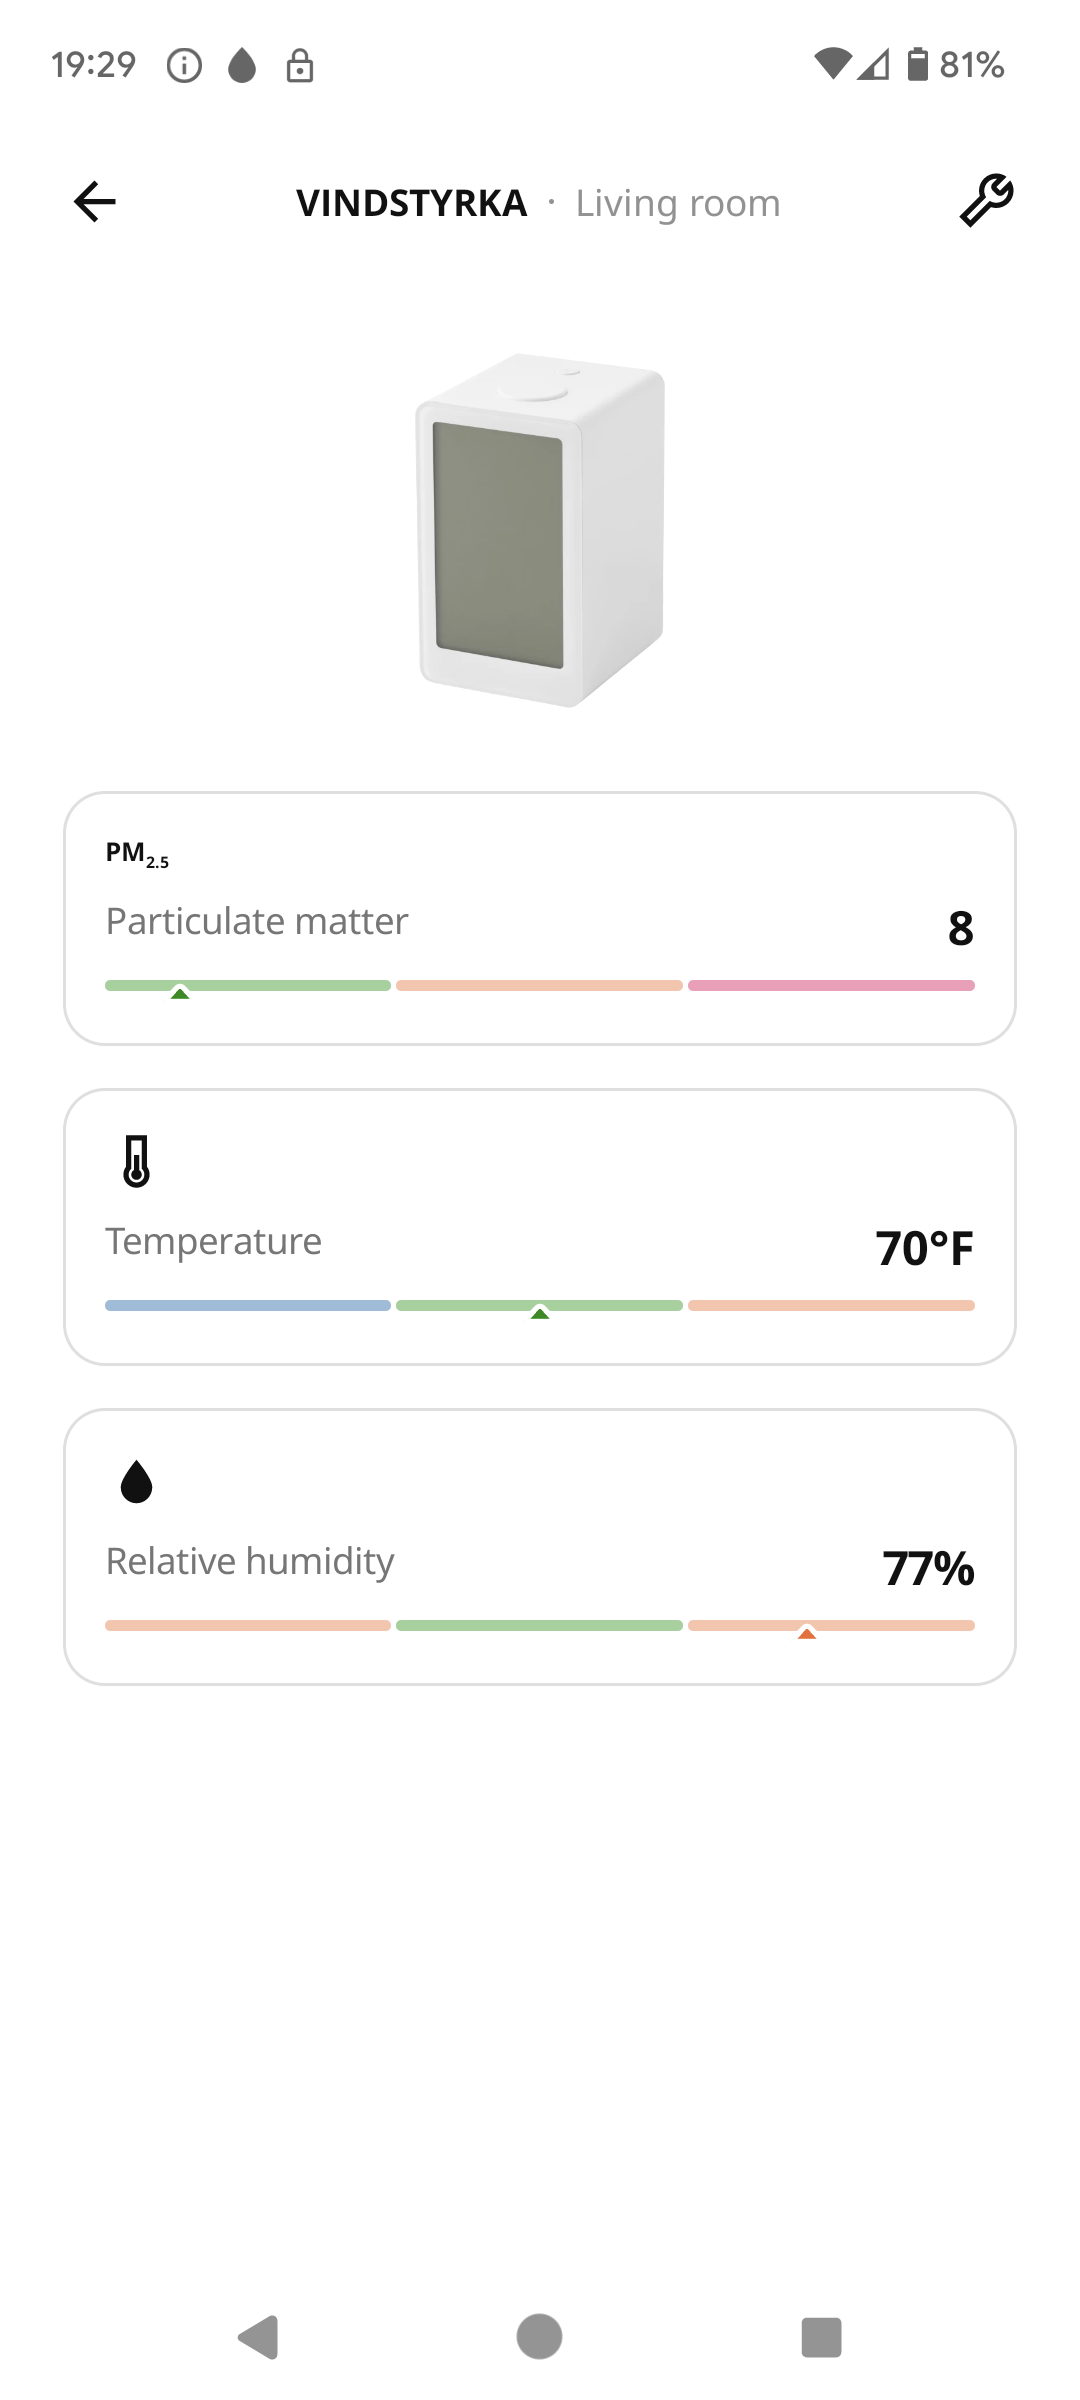
The device, one of its 'manual pages' showing connectivity and its appearane in the IKEA Home smart app:
Inside the VINDSTYRKA is a sensor: Sensirion SEN54 sensor. The manufacturers specifications provide more insight into the device capabilities.
VINSTYRKA and IKEA Home smart
Since this sensor is part of IKEA smart home it can be coupled to an IKEA smart home network via a DIRIGERA hub. The communication between the VINDSTYRKA and DIRIGERA hub uses a protocol called Zigbee, the DIRIGERA hub can be accessed via 'ordinary' TCP/IP. This connectivity opens up the possibility of building your own sensor applications. Below is a diagram of the topology now used by me:

Raspberry Pi setup
To gather information from the VINSTYRKA I use a Raspberry Pi running the desktop version of Ubuntu 22.04.3 LTS at the time of writing. Both hardware and operating system choices are not really important , many other combinations may work as well.
On the system as a normal user I setup a directory for the software:
python3 -m venv dirigera
cd dirigera/
source bin/activate
Some explanation:
Create a database to store information read from the VINDSTYRKA(s)
Create a database for the data from the VINDSTYRKA(s) in your environment (in my case) called 'measurement.db:
sqlite3 measurements.db
Within the database create a table for the measurements:
CREATE TABLE sensor_measurement(timestamp DATETIME DEFAULT CURRENT_TIMESTAMP, room TEXT, temperature INT, humidity  INT,
 pm2_5 INT, tvoc INT);
Create a Python application to read from the VINDSTYRKA(s)
Start out with a script that connects to the hub and reads and prints the sensors information:
import dirigera
hub = dirigera.Hub(
  hub = dirigera.Hub(
  token="..........YOUR..TOKEN.........................................................................",
  ip_address="<IP Address of your DIRIGERA>"
)

current = hub.get_environment_sensors()
for i in range(len(current)):
    print(current[i]);
In my case I have 2 VINDSTYRKA's attached to the DIRIGERA and I get the following output:
EnvironmentSensor(
  device_id='519f42da-bd69-4229-94bf-9c6d1eab4c24_1',
  custom_name='',
  room_id='bf0f1f49-7d4b-4116-84d7-78c8c357eac5',
  room_name='Living room',
  firmware_version='1.0.11',
  hardware_version='1',
  model='VINDSTYRKA',
  manufacturer='IKEA of Sweden',
  serial_number='90AB96FFFEF89CA1',
  can_receive=['customName'],
  dirigera_client=,
  is_reachable=True,
  current_temperature=18, current_rh=75,
  current_pm25=5,
  max_measured_pm25=999,
  min_measured_pm25=0,
  voc_index=387
)
EnvironmentSensor(
  device_id='dd210409-c149-4e0c-9516-4601cb6b42c8_1',
  custom_name='Sensor 2',
  room_id='6dd81fa8-11d9-4a86-8a8a-b465d721df54',
  room_name='Attick',
  firmware_version='1.0.11',
  hardware_version='1',
  model='VINDSTYRKA',
  manufacturer='IKEA of Sweden',
  serial_number='287681FFFE67EC46',
  can_receive=['customName'],
  dirigera_client=,
  is_reachable=True,
  current_temperature=18,
  current_rh=70,
  current_pm25=4,
  max_measured_pm25=999,
  min_measured_pm25=0,
  voc_index=51
)
I can see the information contains the room names I gave the VINDSTARKA's and which data is sent back, the interesting part is:
- room_name: the nae you gave to the VINDSTYRKA
- current_temperature
- current_rh (humidity)
- current_pm25 (PM2.5: fine inhalable particles, with diameters 2.5 micrometers and smaller)
- max_measured_pm25 and min_measured_pm25=0: the minimal and maximal values of current_pm25
- voc_index: total volatile organic compounds (tVOC)
It is very interesting that the tvoc information is much more than the simple 'arrow up', 'down' or 'horizontal', shown by the VINDSTYRKA display and the IKEA Home smart app.
The information now is an integer in range 1..250. The default value is 100.
Mbr>
To store relevant information in the database create a Python script (I call mine 'sensors.py'):
import dirigera
import sqlite3

conn = sqlite3.connect('<Path to your project directory>/measurements.db')
cursor = conn.cursor()

hub = dirigera.Hub(
  token="..........YOUR..TOKEN.........................................................................",
  ip_address="<IP Address of your DIRIGERA>"
)
current = hub.get_environment_sensors()
for i in range(len(current)):
  cursor.execute('''INSERT INTO sensor_measurement(room,temperature,humidity,pm2_5,tvoc)
    VALUES (?,?,?,?,?)''',
    [current[i].room_name,current[i].current_temperature,current[i].current_rh,current[i].current_pm25,current[i].voc_in
dex])
  conn.commit()
conn.close()
The logic is pretty basic:
- import the required packages
- create a hub object
- connect to the DIRIGERA and get sensor information
- the returned information is an array of values for each sensor known by the DIRIGERA
- insert the information for each sensor into the database table
Schedule gathering information using 'cron'
In order to gather information over longer regular intervals create a bash script (sensors.sh) that sets the environment and runs the Python script:
#!/bin/bash
source '<Path to your project directory>/activate
python3 '<Path to your project directory>/sensors.py
Then create a crontab entry using 'crontab -e':
# m h  dom mon dow   command
  */20  *  *  *  *  /home/jvdmeiden/projects/dirigera/sensors.sh 2>&1 | logger
For debugging it is usefull to have the the cronjob write errors to 'logger', the syslog will give a hint of what went wrong in case of problems.
Making sense of the gathered data
the database will contain data like:
sqlite> select * from sensor_measurement where room = 'Living room';
2023-11-19 12:20:02|Living room|18|66|5|59
2023-11-19 12:40:02|Living room|18|66|5|57
2023-11-19 13:00:02|Living room|18|67|5|58
2023-11-19 13:20:02|Living room|18|67|5|61
2023-11-19 13:40:03|Living room|18|67|6|67
2023-11-19 14:00:02|Living room|18|67|6|63
2023-11-19 14:20:02|Living room|18|67|6|58
2023-11-19 14:40:02|Living room|18|67|6|58
2023-11-19 15:00:02|Living room|18|67|7|65
2023-11-19 15:20:02|Living room|18|68|5|168
2023-11-19 15:40:02|Living room|18|75|7|376
2023-11-19 16:00:02|Living room|18|76|8|396
2023-11-19 16:20:02|Living room|18|76|7|360
2023-11-19 16:40:02|Living room|18|75|7|312
2023-11-19 17:00:02|Living room|19|75|6|319
2023-11-19 17:20:02|Living room|19|74|5|103
2023-11-19 17:40:02|Living room|19|76|7|102
2023-11-19 18:00:03|Living room|19|76|7|97
2023-11-19 18:20:02|Living room|19|77|6|108
2023-11-19 18:40:02|Living room|19|76|6|71
2023-11-19 19:00:02|Living room|19|76|5|60
2023-11-19 19:20:02|Living room|19|75|6|43
This shows the increase in tVOC during coocking (not something to get alarmed about).
It can be plotted as a graph:

Conclusion
Using a DIRIGERA hub and a RASPBERRY Pi it is relativly easy to gather data from the VINDSTYRKA for analysis.
To be continued
- Gather data from multiple VINDSTYKA sensors and compare them.
- Correlate the data from the VINDSTYRKA's with weather data.
- Circumvent the DIRIGERA by connecting at Zigbee level.
- Replace the VINDSTYRKA by the sensor that is inside Sensirion SN54.
- Better understand the meaning of various values like tVOC by placing the sensor in a confined space and expose it to things like alcohol vopor, smoke, et cetera.
- Create a front end that shows the information in graphs.
Links: